This page has a number of charts depicting my cycling since October 2000. The charts reflect data through October 9th, 2007.
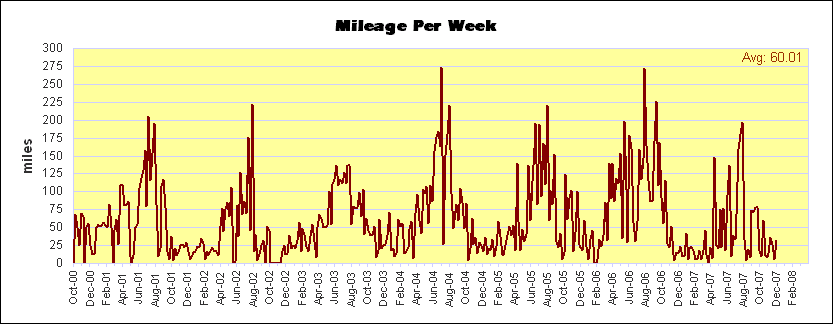
This chart shows how much I rode each week. I try to do 25-50 miles per week in the winter, and 75-125 in the summer.
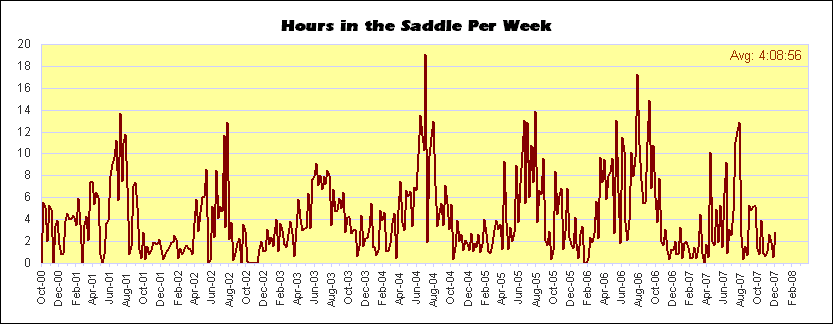
Hours are pretty closely related to mileage (the preceding chart). I typically spend 2-4 hours per week on my bike in the winter, and 4-10 hours in the summer.
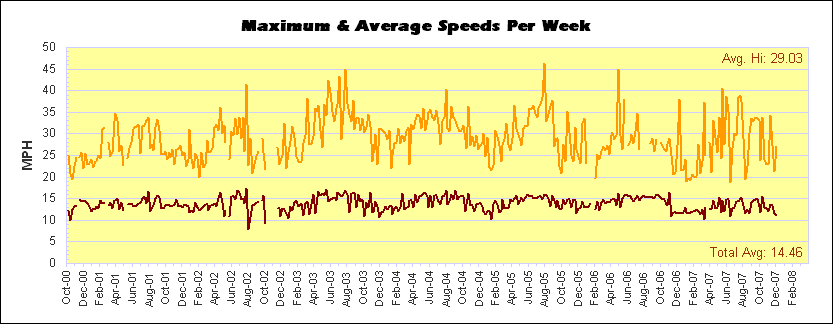
Max speed (orange) really doesn't mean much, but it's still fun to note the peaks. My average speed (brown) stays in the 14-16 mph range. The zero values are weeks when I was unable to ride or radio interference invalidated the measurement.
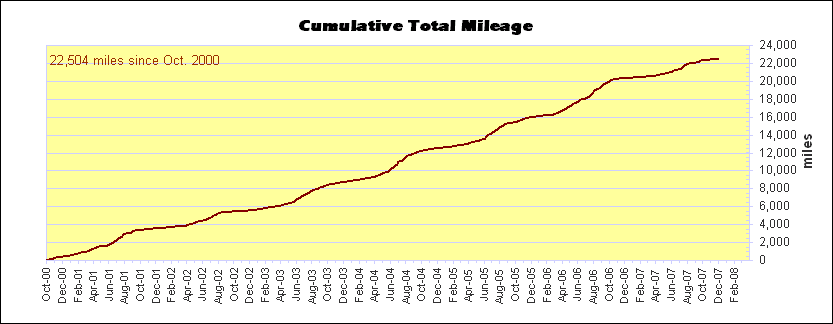
Here's the big chart of my riding history; it's pretty consistent, with peaks in the summer and valleys in the winter.
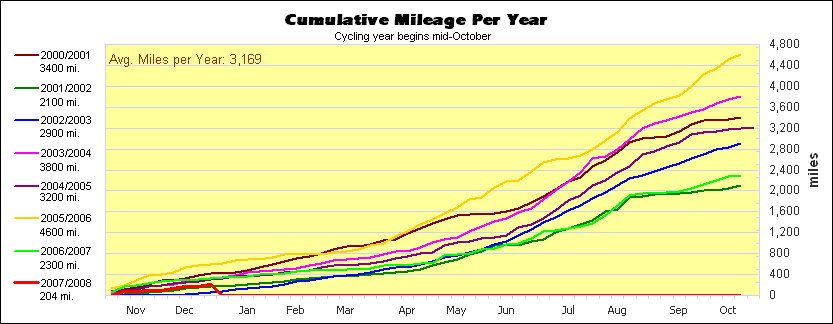
This chart shows how much I cycled each year, so that comparisons can be made between years.
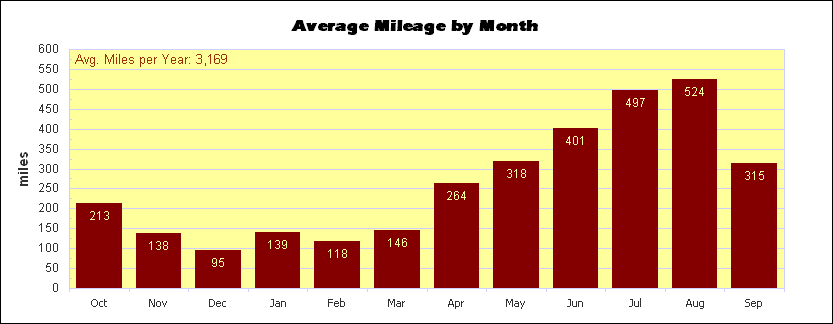
Here's what each month of an average year looks like.
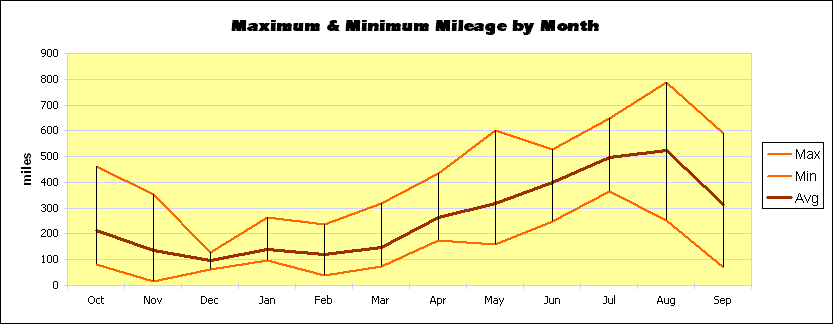
Same chart as above, but this one highlights the max and minimum amount I've ridden each month.