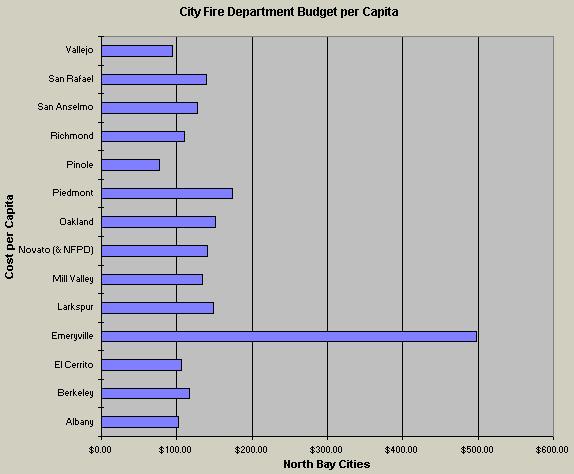
EL CERRITO
FIRE DEPARTMENT
 
COMPARATORS


City Fire Department Budgets per Capita
FY 1995-1996 - Bay Area by Population Groupings
Population 10,000 to 25,000:
Department Population Budget Budget Per Capita Percent of ECFD
Albany 17,404 1,778,375 $102.18  95.95%
El Cerrito 23,816 2,536,320 $106.50  100.00%
Hillsborough 11,280 2,421,540 $214.68  201.58%
Larkspur 11,976 1,784,884 $149.04  139.95%
Mill Valley 14,000 1,878,505 $134.18  125.99%
Piedmont 11,288 1,959,497 $173.59  163.00%
Pinole 18,530 1,423,317 $76.81  72.13%
San Anselmo 12,405 1,585,747 $127.83  120.03%
 AVERAGE 15,087 1,921,023 $135.60  127.33%
Population 25,001 to 50,000:
Department Population Budget Budget Per Capita Percent of ECFD
Benicia 27,817 3,073,877 $110.50  103.76%
Burlingame 28,327 4,827,652 $170.43  160.03%
Campbell 38,267 3,133,789 $81.89  76.90%
Dublin 26,581 3,056,862 $115.00  107.99%
Foster City 29,503 3,265,400 $110.68  103.93%
Los Altos 27,299 3,897,596 $142.77  134.06%
Newark 39,977 4,290,192 $107.32  100.77%
Novato (& NFPD) 49,072 6,935,514 $141.33  132.71%
Petaluma 48,569 5,602,655 $115.35  108.32%
San Carlos 28,047 3,033,538 $108.16  101.56%
 AVERAGE 34,346 4,111,708 $120.34  113.00%
Population 50,001 to 100,000:
Department Population Budget Budget Per Capita Percent of ECFD
Alameda 80,815 10,476,586 $129.64  121.73%
Daly City 99,803 6,720,956 $67.34  63.23%
Fairfield 87,722 4,780,170 $54.49  51.17%
Livermore 65,438 6,077,103 $92.87  87.20%
Milpitas 59,725 8,378,037 $140.28  131.72%
Mtn. View 71,496 8,140,830 $113.86  106.92%
Palo Alto 58,575 10,978,505 $187.43  175.99%
Pleasanton 57,775 6,493,091 $112.39  105.53%
Redwood City 71,800 7,776,152 $108.30  101.70%
Richmond 93,015 10,231,072 $109.99  103.28%
San Leandro 72,307 9,676,874 $133.83  125.67%
San Mateo 92,017 8,600,982 $93.47  87.77%
San Rafael 53,247 7,449,575 $139.91  131.37%
Santa Clara 98,159 18,177,075 $185.18  173.88%
South SF 57,335 6,955,222 $121.31  113.91%
Union City 58,484 4,076,946 $69.71  65.46%
 AVERAGE 73,607 8,436,824 $116.25  109.16%
To Table of Contents 


To Table of Contents 


City Fire Department Budget per Capita
FY 1995-1996 - Contiguous North Bay Agencies
Department Population Budget Per Capita Per Capita
Albany 17,404 1,778,375 $102.18  87.28%
Berkeley 105,855 12,392,208 $117.07  109.93%
El Cerrito 23,816 2,536,320 $106.50  90.97%
Emeryville 6,492 3,234,029 $498.16  467.77%
Larkspur 11,976 1,784,884 $149.04  127.31%
Mill Valley 14,000 1,878,505 $134.18  114.62%
Novato (& NFPD) 49,072 6,935,514 $141.33  120.73%
Oakland 386,779 58,631,303 $151.59  142.34%
Piedmont 11,288 1,959,497 $173.59  148.28%
Pinole 18,530 1,423,317 $76.81  65.61%
Richmond 93,015 10,231,072 $109.99  93.96%
San Anselmo 12,405 1,585,747 $127.83  109.19%
San Rafael 53,247 7,449,575 $139.91  119.51%
Vallejo 116,148 10,944,886 $94.23  88.48%
Mean: 65,716 8,768,945 $151.60  142.35%
To Table of Contents 

 
EMERGENCY INCIDENTS per FIRE DEPARTMENT STAFF
El Cerrito Fire Department - FY 1995-96 (Excluding Kensington)
Department Volunteer Total Uniformed Staff Population Fire, Medical, Rescue Incidents Incidents per Staff Percent to ECFD
Alameda  NO 98 77,536 4,707 48.03 64.07%
Albany  NO 20 17,404 1,390 69.50 92.71%
Berkeley  NO 129 103,724 11,112 86.14 114.91%
Brisbane  NO 14 30,000 730 52.14 69.56%
Contra Costa FPD  NO 424 500,000 30,255 71.36 95.19%
Daly City  NO 75 99,803 4,538 60.51 80.72%
El Cerrito  NO 26 23,000 1,949 74.96 100.00%
Hayward  NO 134 118,000 9,134 68.16 90.93%
Larkspur  NO 18 12,000 996 55.33 73.82%
Mill Valley  NO 39 14,000 1,924 49.33 65.81%
Milpitas  NO 67 60,000 3,080 45.97 61.32%
Mtn. View  NO 68 70,000 4,471 65.75 87.71%
Piedmont  NO 25 11,000 1,150 46.00 61.36%
Pinole Paid Only 15 18,530 1,183 78.87 105.21%
Oakland NO  446 377,900 62,241 139.55 186.17%
Richmond NO  103 91,252 11,295 109.66 146.29%
San Leandro NO  87 70,000 6,160 70.80 94.45%
San Ramon FPD NO  148 92,000 4,069 27.49 36.68%
Union City NO  38 55,000 3,050 80.26 107.07%
Mean: 68.41 91.26%
Median: 68.16 90.93%
Standard Deviation: 25.11 33.50%
Lowest Value: 27.49 0.37
Highest Value: 139.55 186.17%
Kensington NO  10 5,050  499 49.90 66.57%
 
NOTE: Lower ratio values than El Cerrito (and percentages lower than 100 %) show agencies that handle fewer incidents for each staff member than El Cerrito. Greater ratio values than El Cerrito (and percentages above 100 %) show agencies that handle more incidents for each staff member than El Cerrito.

To Table of Contents 


FIRE DEPARTMENT STAFF per 1000 POPULATION SERVED
El Cerrito Fire Department - FY 1995/1996 (Excluding Kensington)
Department Volunteer Total Uniformed Staff Population Staff/1000 Pop Percent to ECFD
Albany NO  21 17,404 1.21 110.53%
El Cerrito NO  26 23,816 1.09 100.00%
Hillsborough NO  24 11,280 2.13 194.89%
Larkspur NO  18 11,976 1.50 137.68%
Mill Valley NO  39 14,000 2.79 255.17%
Piedmont NO  25 11,288 2.21 202.87%
Pinole Paid Only 17 18,530 0.92 84.04%
Burlingame NO  56 28,327 1.98 181.09%
Campbell Yes 36 38,267 0.94 86.17%
Newark NO  42 39,977 1.05 96.24%
Alameda NO  98 80,815 1.21 111.08%
Daly City NO  75 99,803 0.75 68.84%
Milpitas NO  67 59,725 1.12 102.76%
Mtn. View NO  68 71,496 0.95 87.12%
Redwood City NO  70 71,800 0.97 89.30%
Richmond NO  98 93,015 1.05 96.51%
San Leandro NO  87 72,307 1.20 110.21%
San Rafael NO  93 53,247 1.75 159.99%
South SF NO  80 57,335 1.40 127.81%
Union City NO  38 58,484 0.65 59.52%
Mean: 1.37 125.07%
Median: 1.16 106.49%
Standard Deviation: 0.58 53.31%
Lowest Value: 0.65 59.52%
Highest Value: 2.79 255.17%
Kensington NO  10 5,050 1.98 181.39%
 
Small to medium size fire departments with no volunteers or limited use of volunteers
11 out of 19 fire departments (58 %) with greater than ECFD staff-to-population ratio

El Cerrito provides fire protection services to the Kensington Fire Protection District under a contract for a fee which reimburses El Cerrito for its costs. Provision of these services includes the costs for 10 employees. The table above shows the effect to El Cerrito of having a fire department with a staff to population ratio higher than that ratio for which the City of El Cerrito is paying directly.

To Table of Contents 


FIRE DEPARTMENT STAFF per 1000 POPULATION SERVED
El Cerrito Fire Department - FY 1995/1996 (Including Kensington)
Department Volunteer Total Uniformed Staff Population Staff/1000 Pop Percent to ECFD
Albany NO  21 17,404 1.21 99.10%
El Cerrito NO  36 29,566 1.22 100.00%
Hillsborough NO  24 11,280 2.13 174.74%
Larkspur NO  18 11,976 1.50 123.44%
Mill Valley NO  39 14,000 2.79 228.78%
Piedmont NO  25 11,288 2.21 181.89%
Pinole Paid Only 17 18,530 0.92 75.35%
Burlingame NO  56 28,327 1.98 162.36%
Campbell Yes 36 38,267 0.94 77.26%
Newark NO  42 39,977 1.05 86.28%
Alameda NO  98 80,815 1.21 99.59%
Daly City NO  75 99,803 0.75 61.72%
Milpitas NO  67 59,725 1.12 92.13%
Mtn. View NO  68 71,496 0.95 78.11%
Redwood City NO  70 71,800 0.97 80.07%
Richmond NO  98 93,015 1.05 86.53%
San Leandro NO  87 72,307 1.20 98.82%
San Rafael NO  93 53,247 1.75 143.44%
South SF NO  80 57,335 1.40 114.59%
Union City NO  38 58,484 0.65 53.36%
Mean: 1.37 112.14%
Standard Deviation: 0.58 47.80%
 
To Table of Contents

 
Back to Table of Contents
Go back to BUDGET
Go to ALTERNATIVE SYSTEMS
Go to the Home Page of the Committee of the Whole
Return to previous page: