(flashover graphic goes here)
|
|
|||||
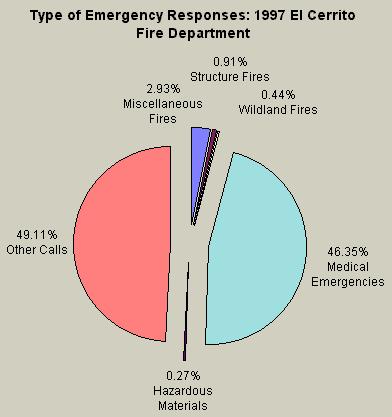
| Type | Percent | Number | Loss | Value | Loss % of Value |
| Miscellaneous Fires | 2.93% | 87 | 272,615 | 13,716,160 | 1.99% |
| Structure Fires | 0.91% | 27 | 163,525 | 4,923,850 | 3.32% |
| Wildland Fires | 0.44% | 13 | 2,050 | 2,601,750 | 0.08% |
| Medical Emergencies | 46.35% | 1378 | |||
| Hazardous Materials | 0.27% | 8 | |||
| Other Calls | 49.11% | 1460 | |||
| Total Incidents | 2932 | 438,190 | 21,241,760 | 2.06% | |
Back to Table of Contents
Go back to ORGANIZATION
Go to BUDGET
Go to the Home
Page of the Committee of the Whole